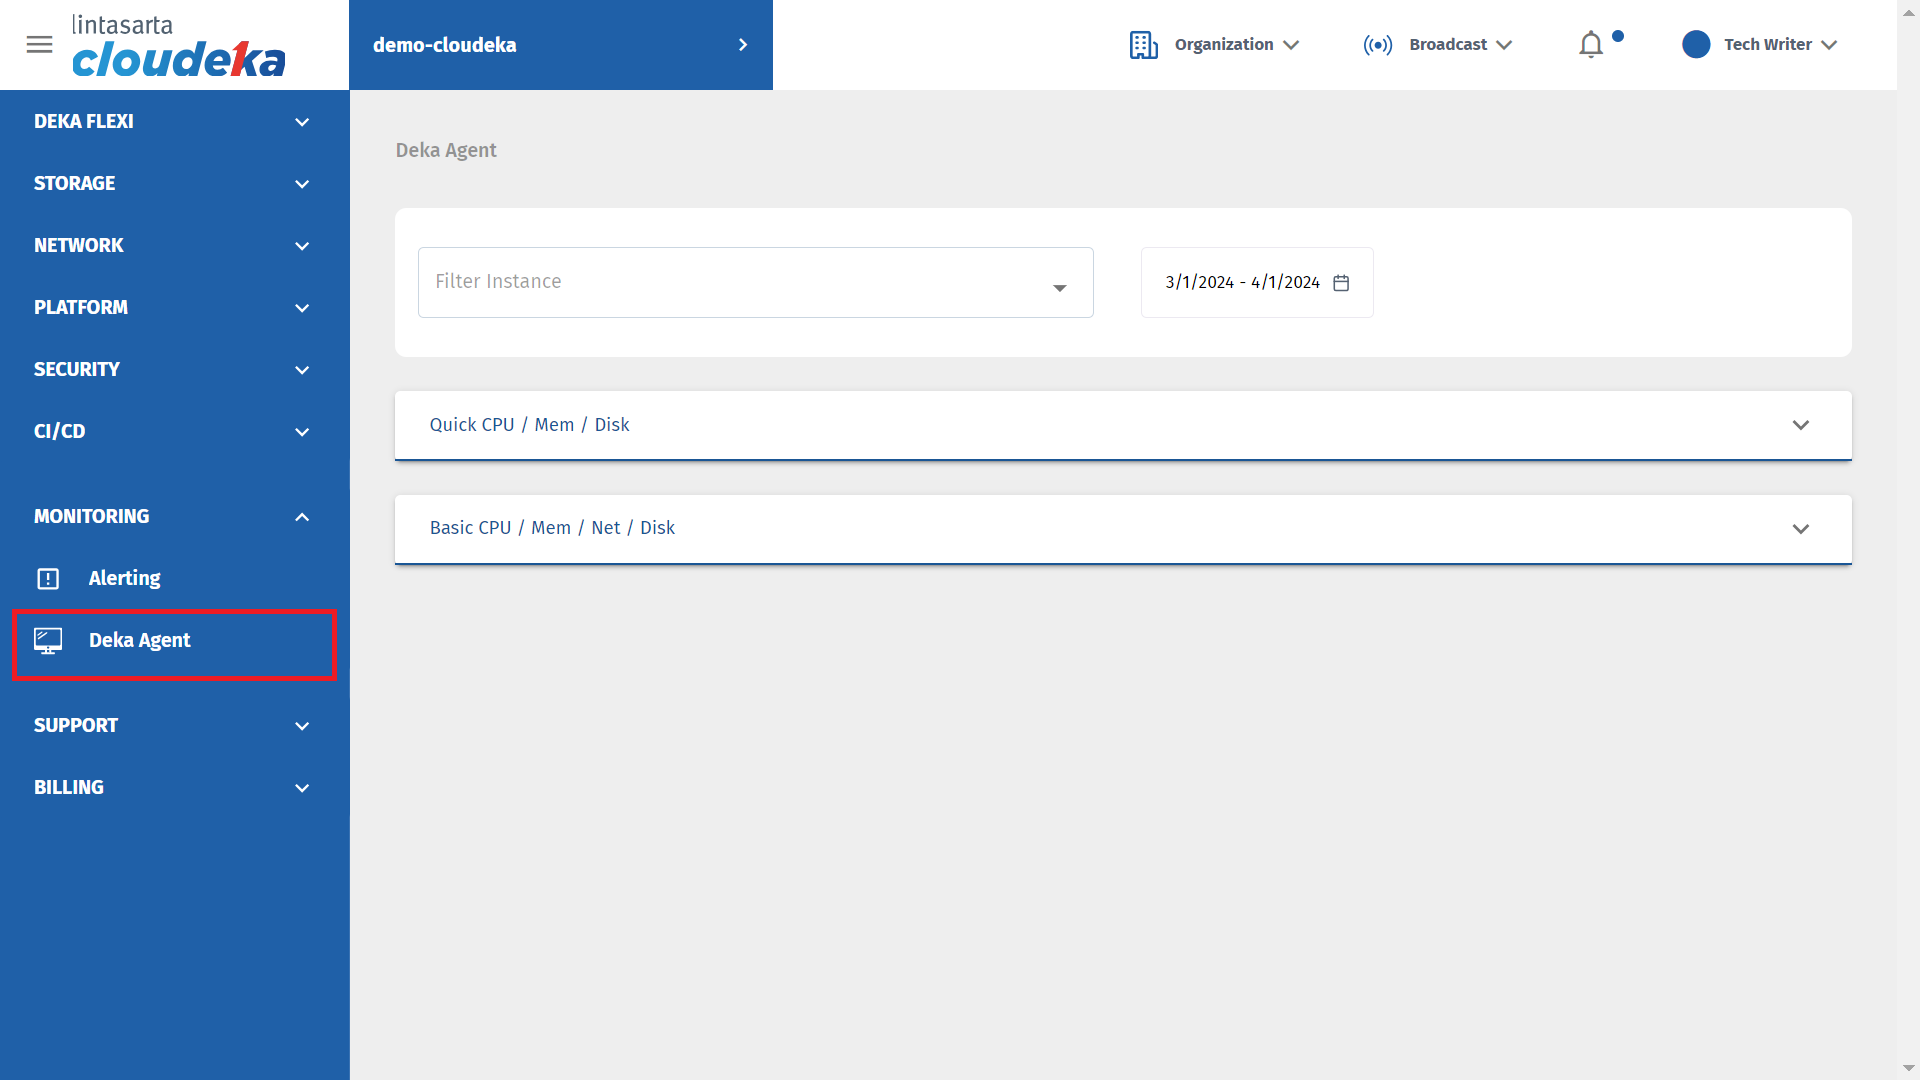
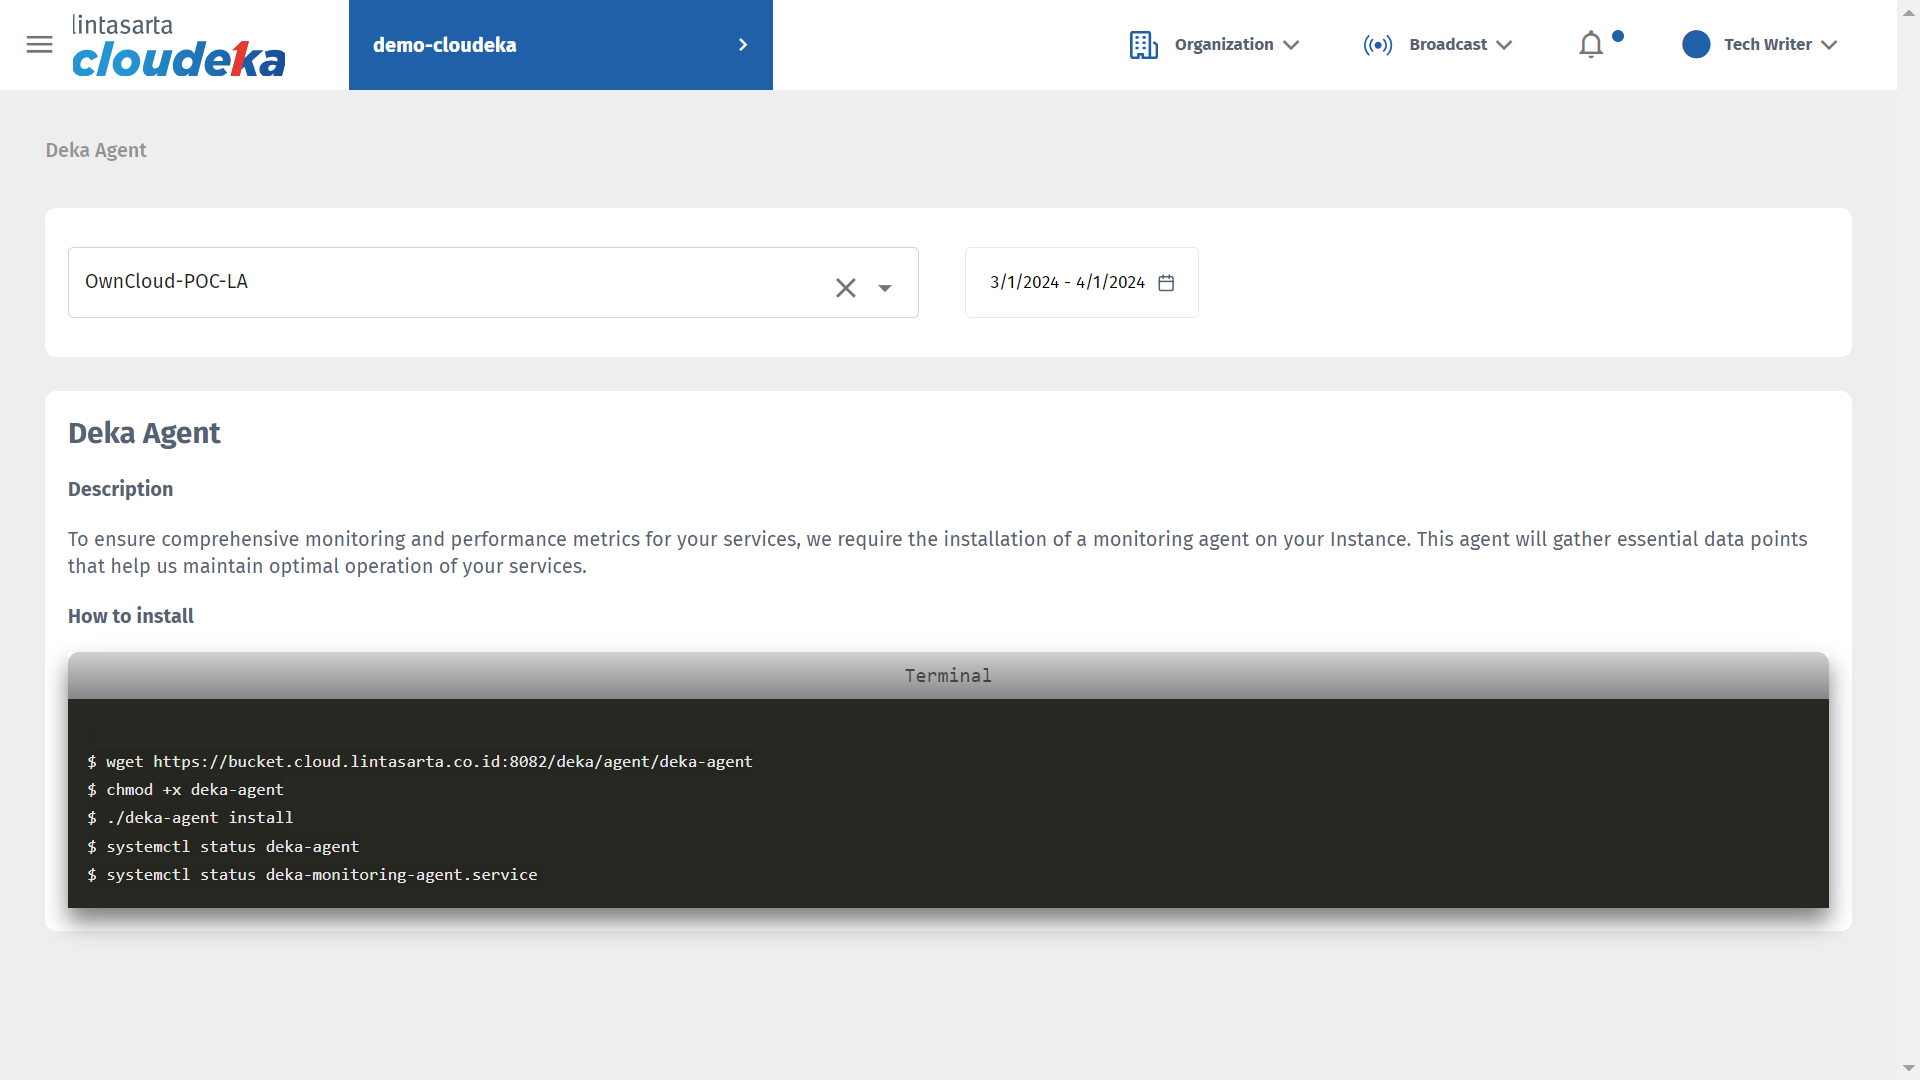
Monitoring Deka Agent
Monitoring Deka Agent
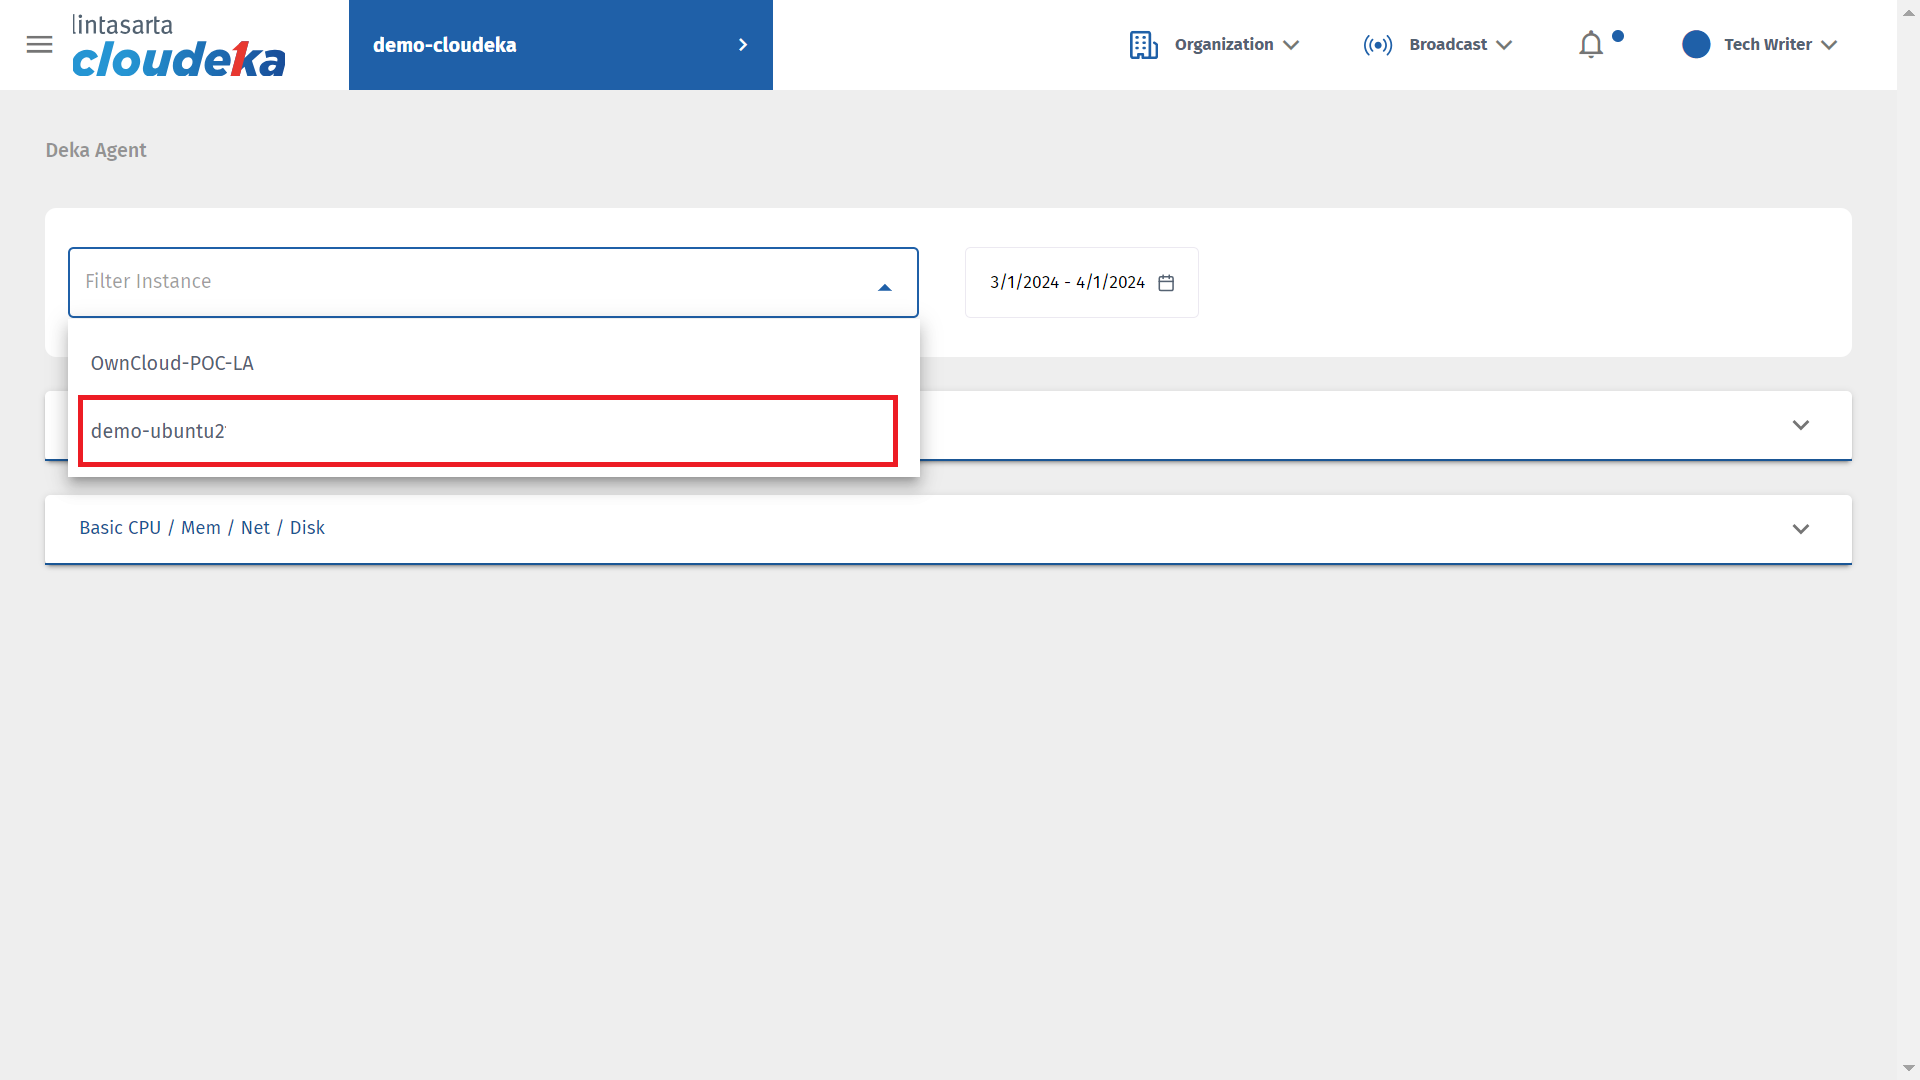
Filter Instance
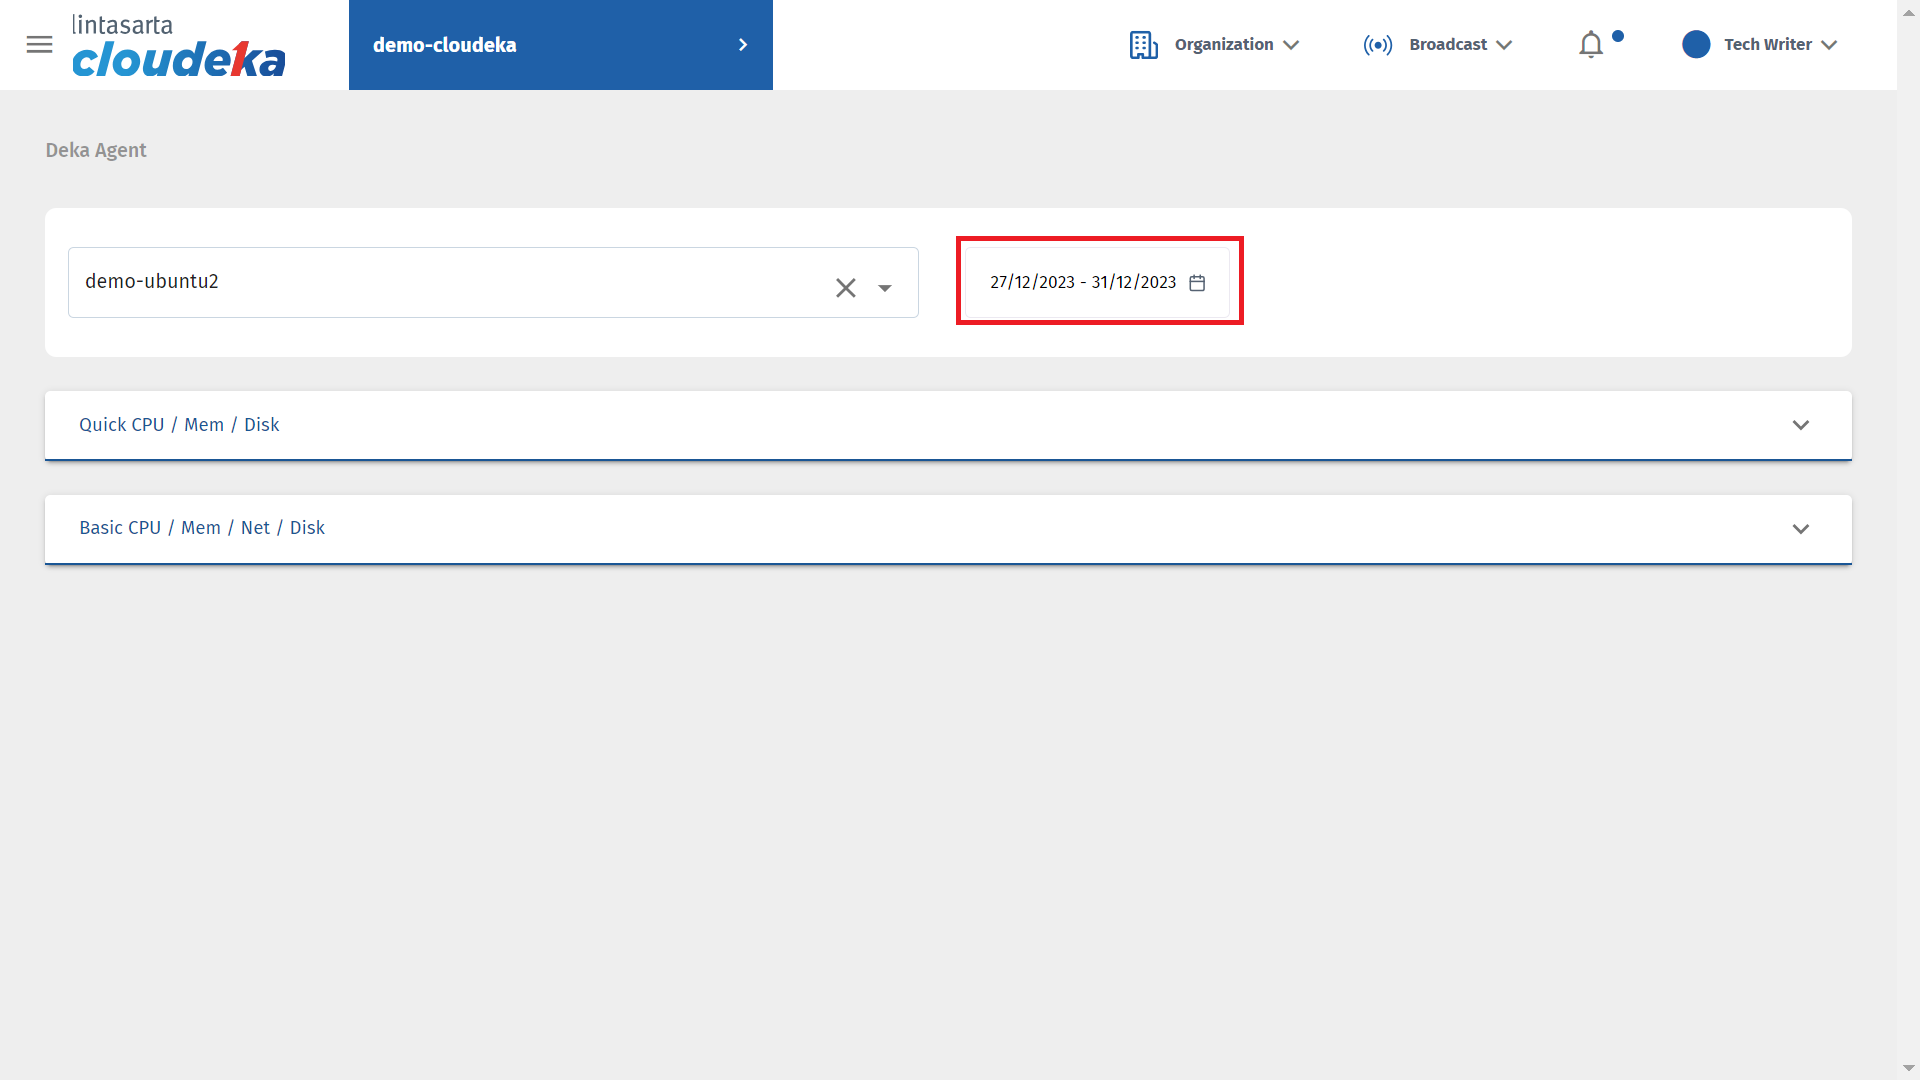
Date Picker (a)
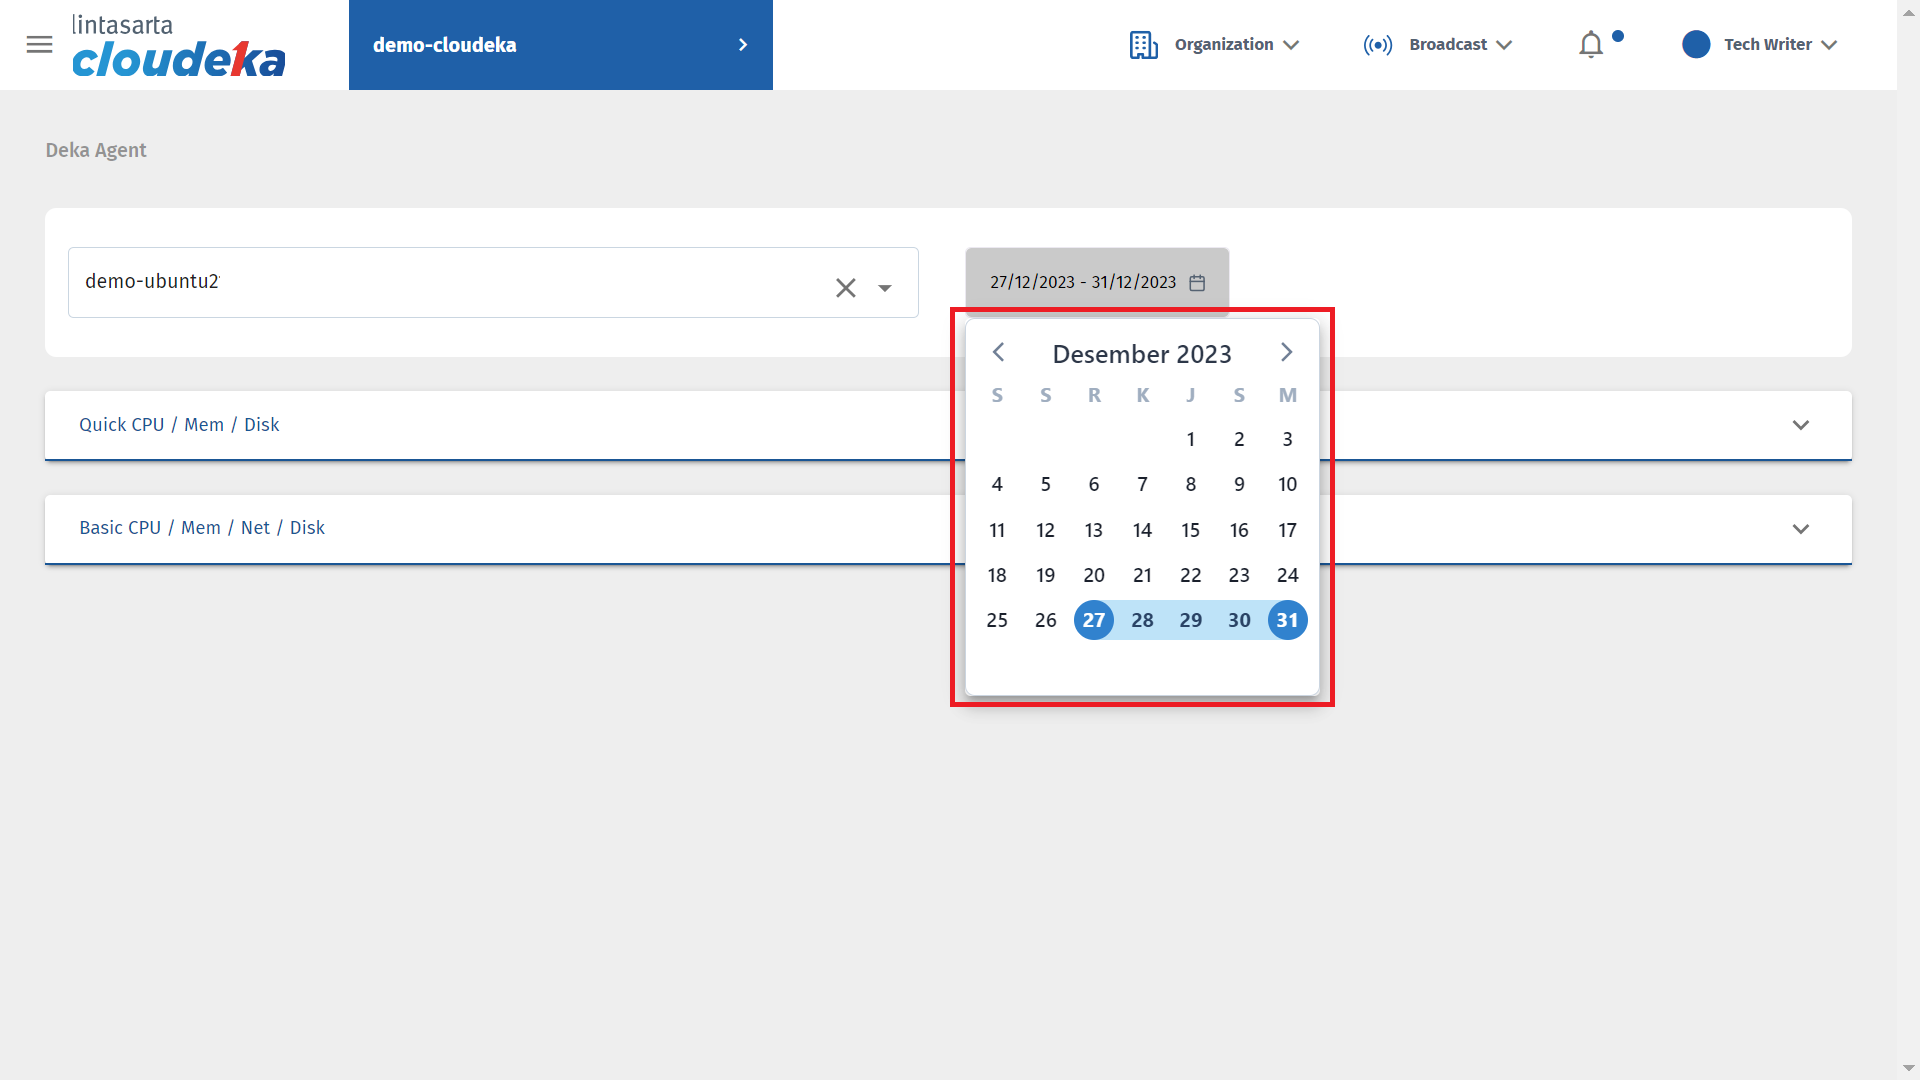
Date Picker (b)
Monitoring Deka Agent - Result
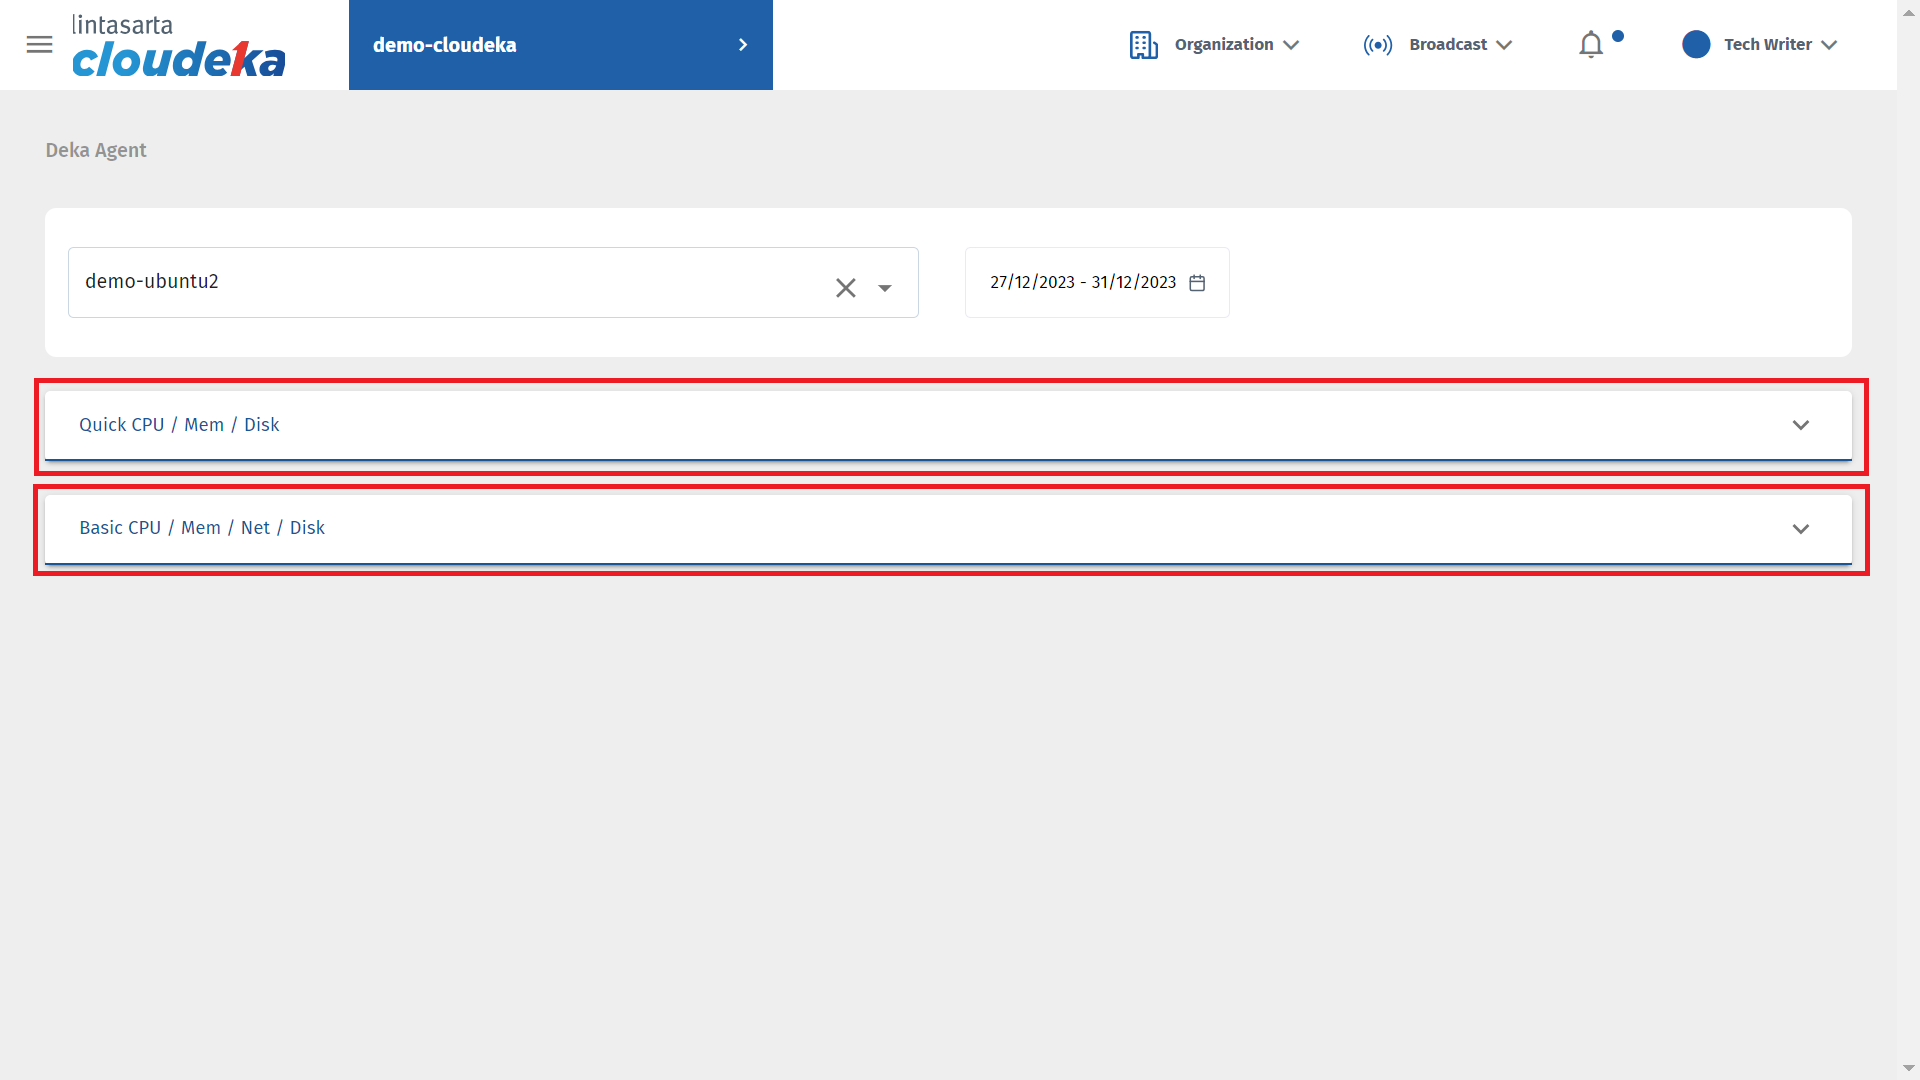
Monitoring Deka Agent - Result
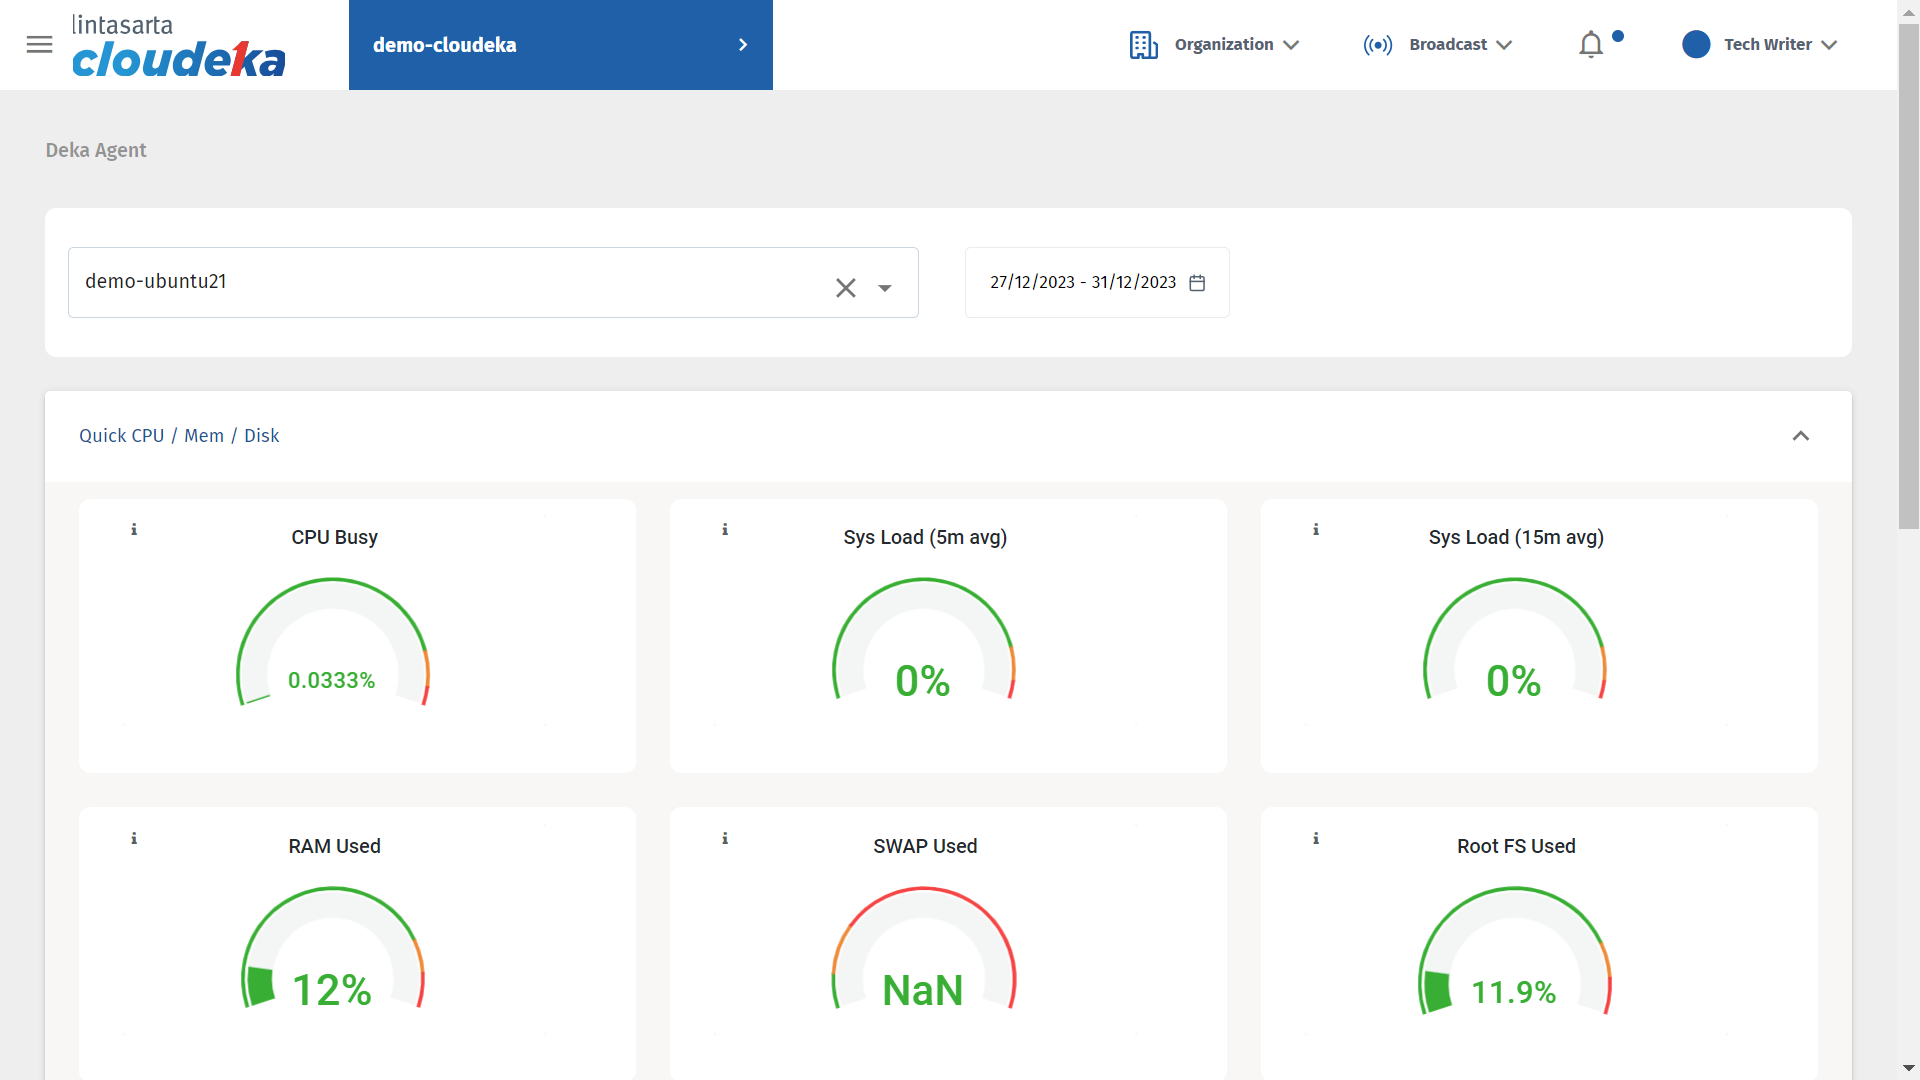
Quick CPU / Mem / Disk (a)
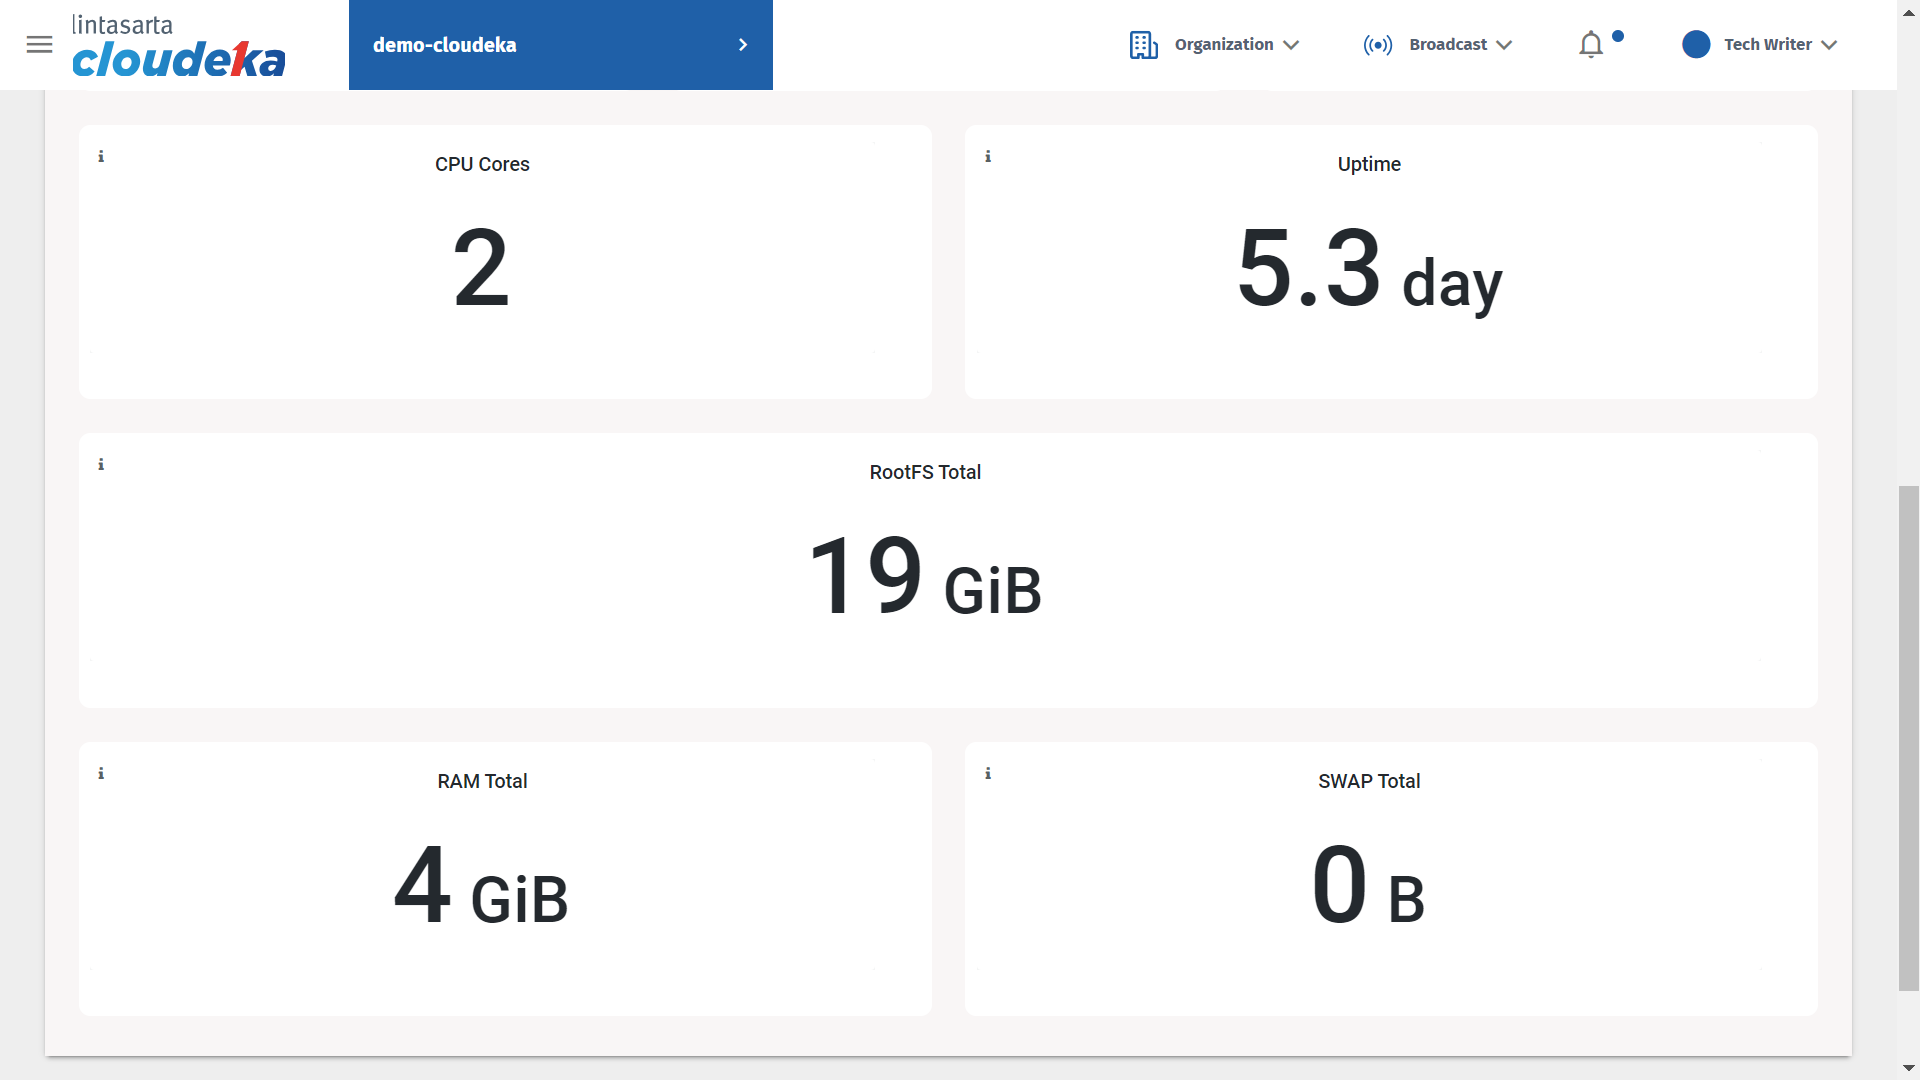
Quick CPU / Mem / Disk (b)
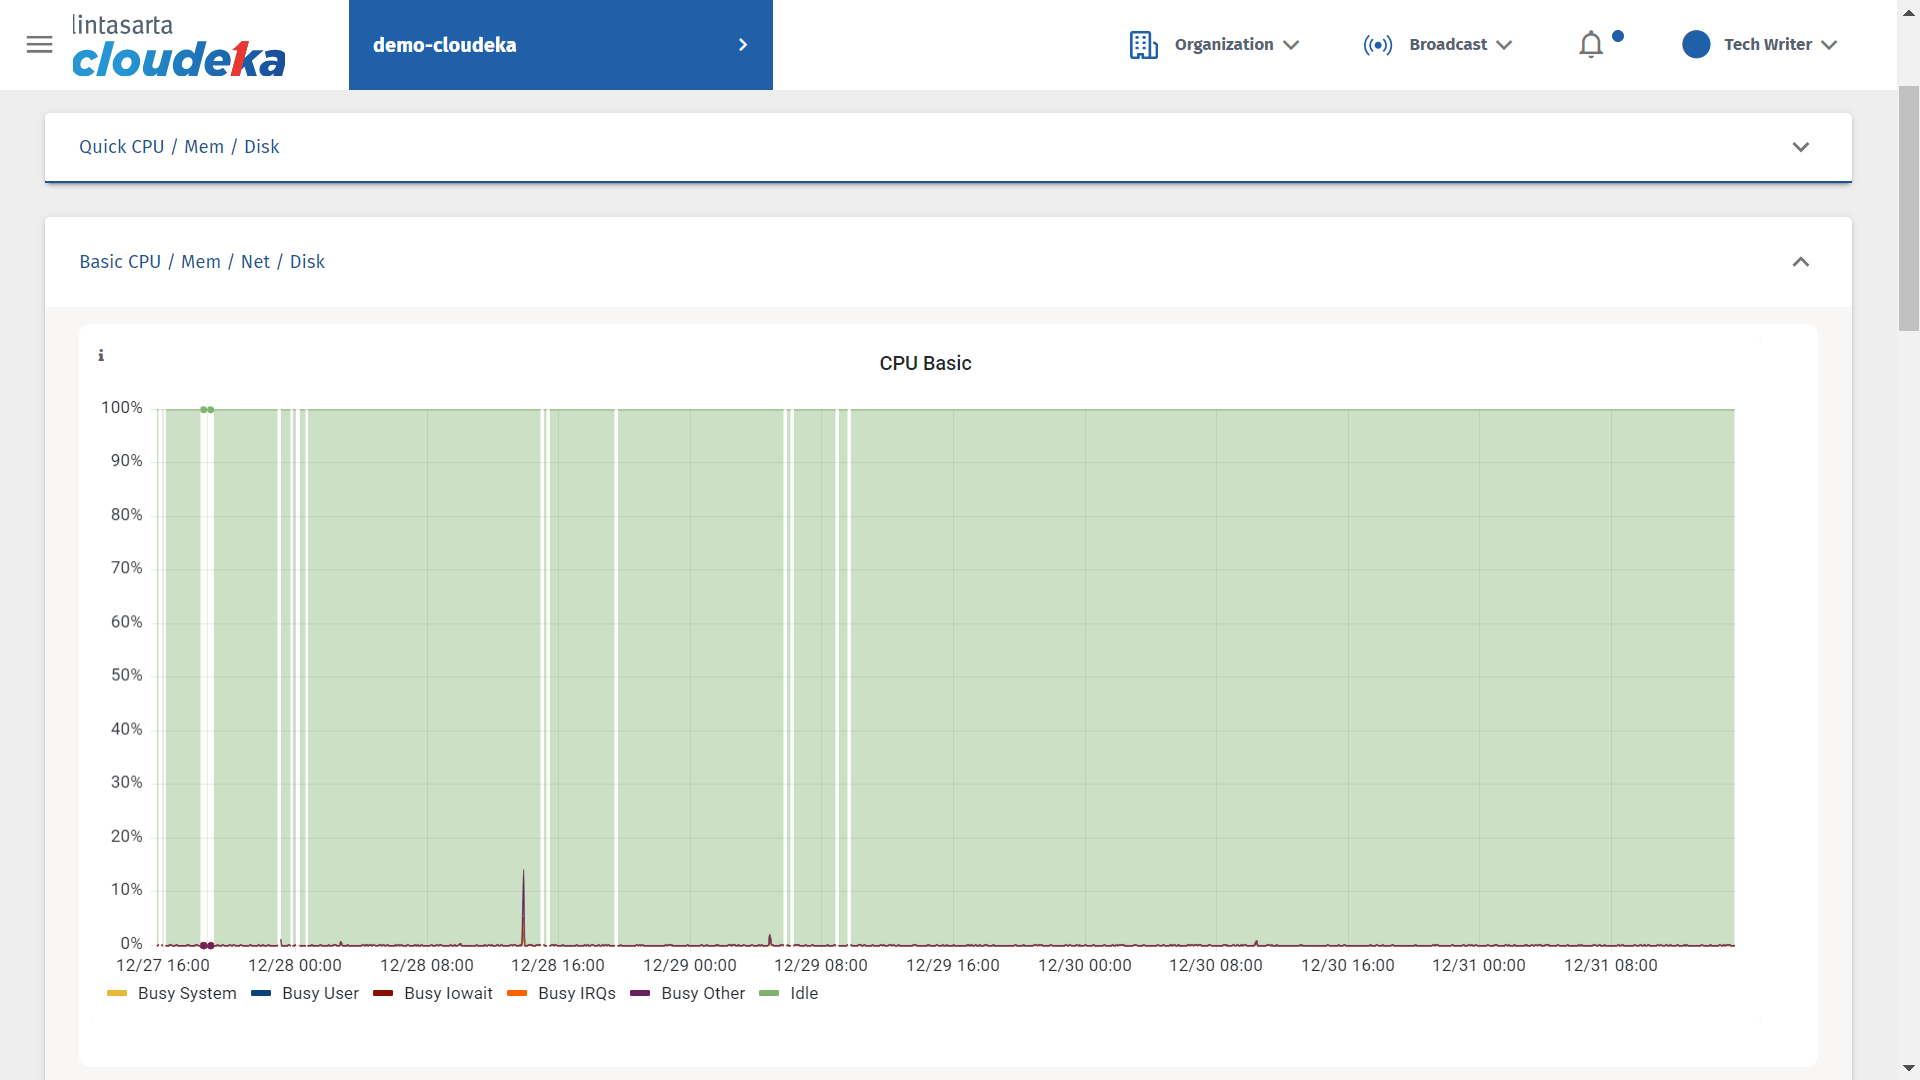
Basic CPU / Mem / Net / Disk - Memory Basic
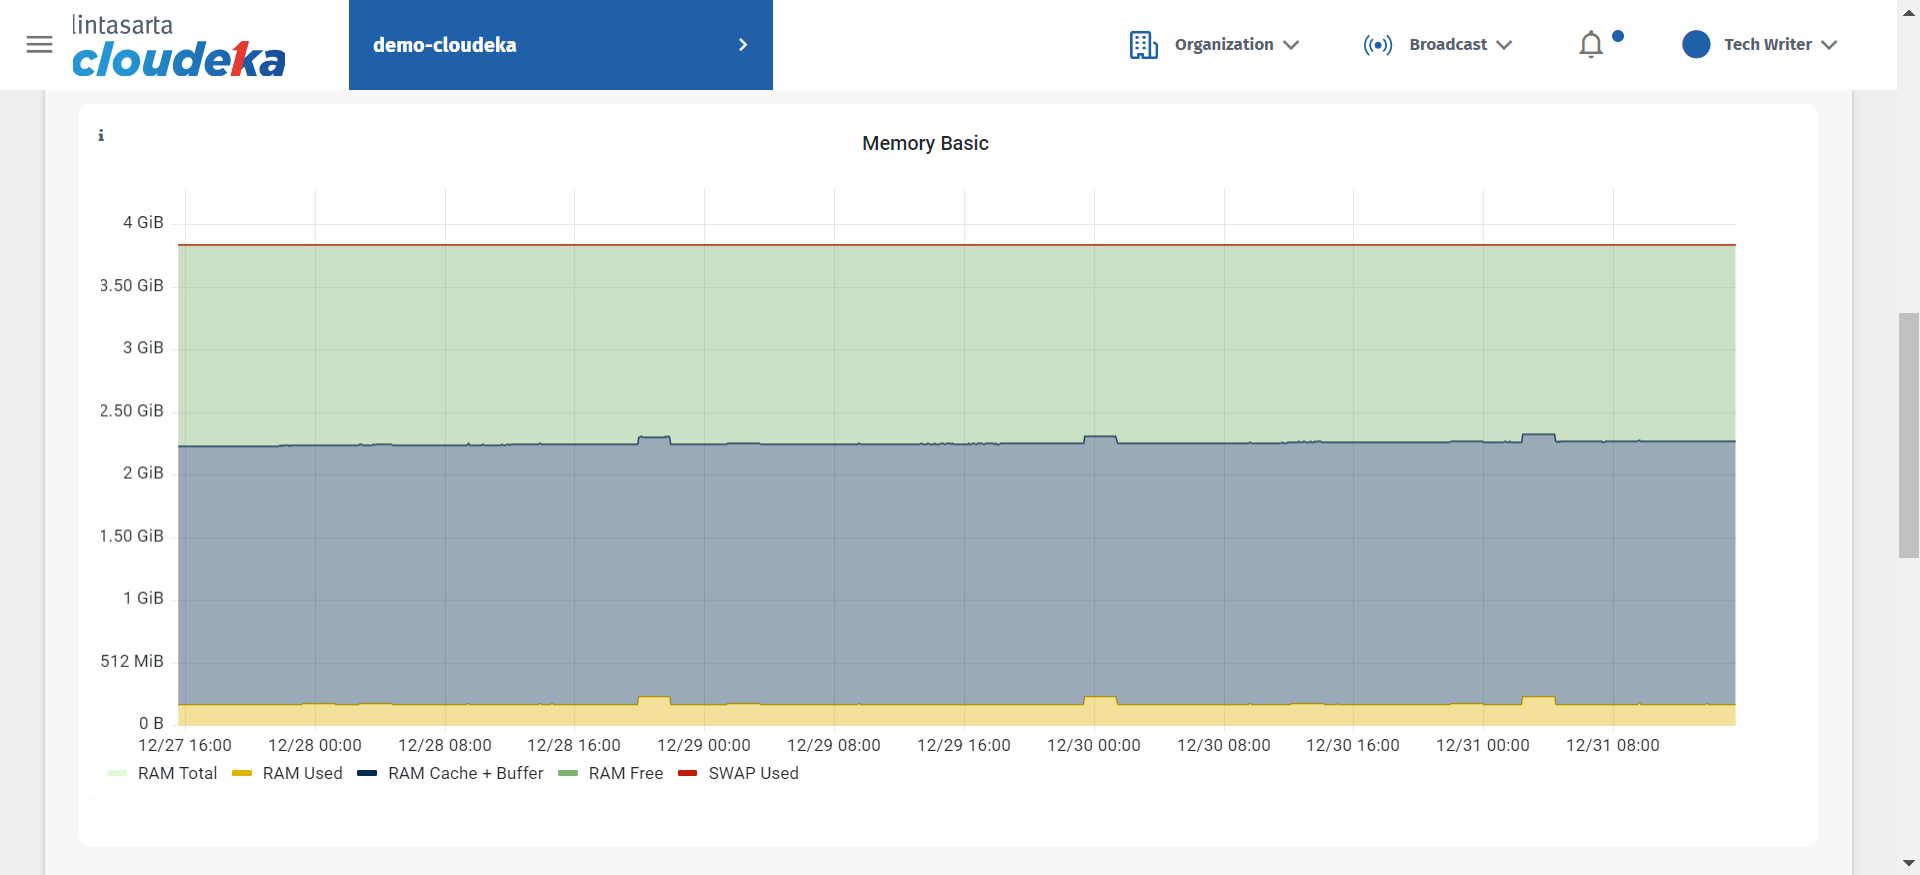
Basic CPU / Mem / Net / Disk - Memory Basic
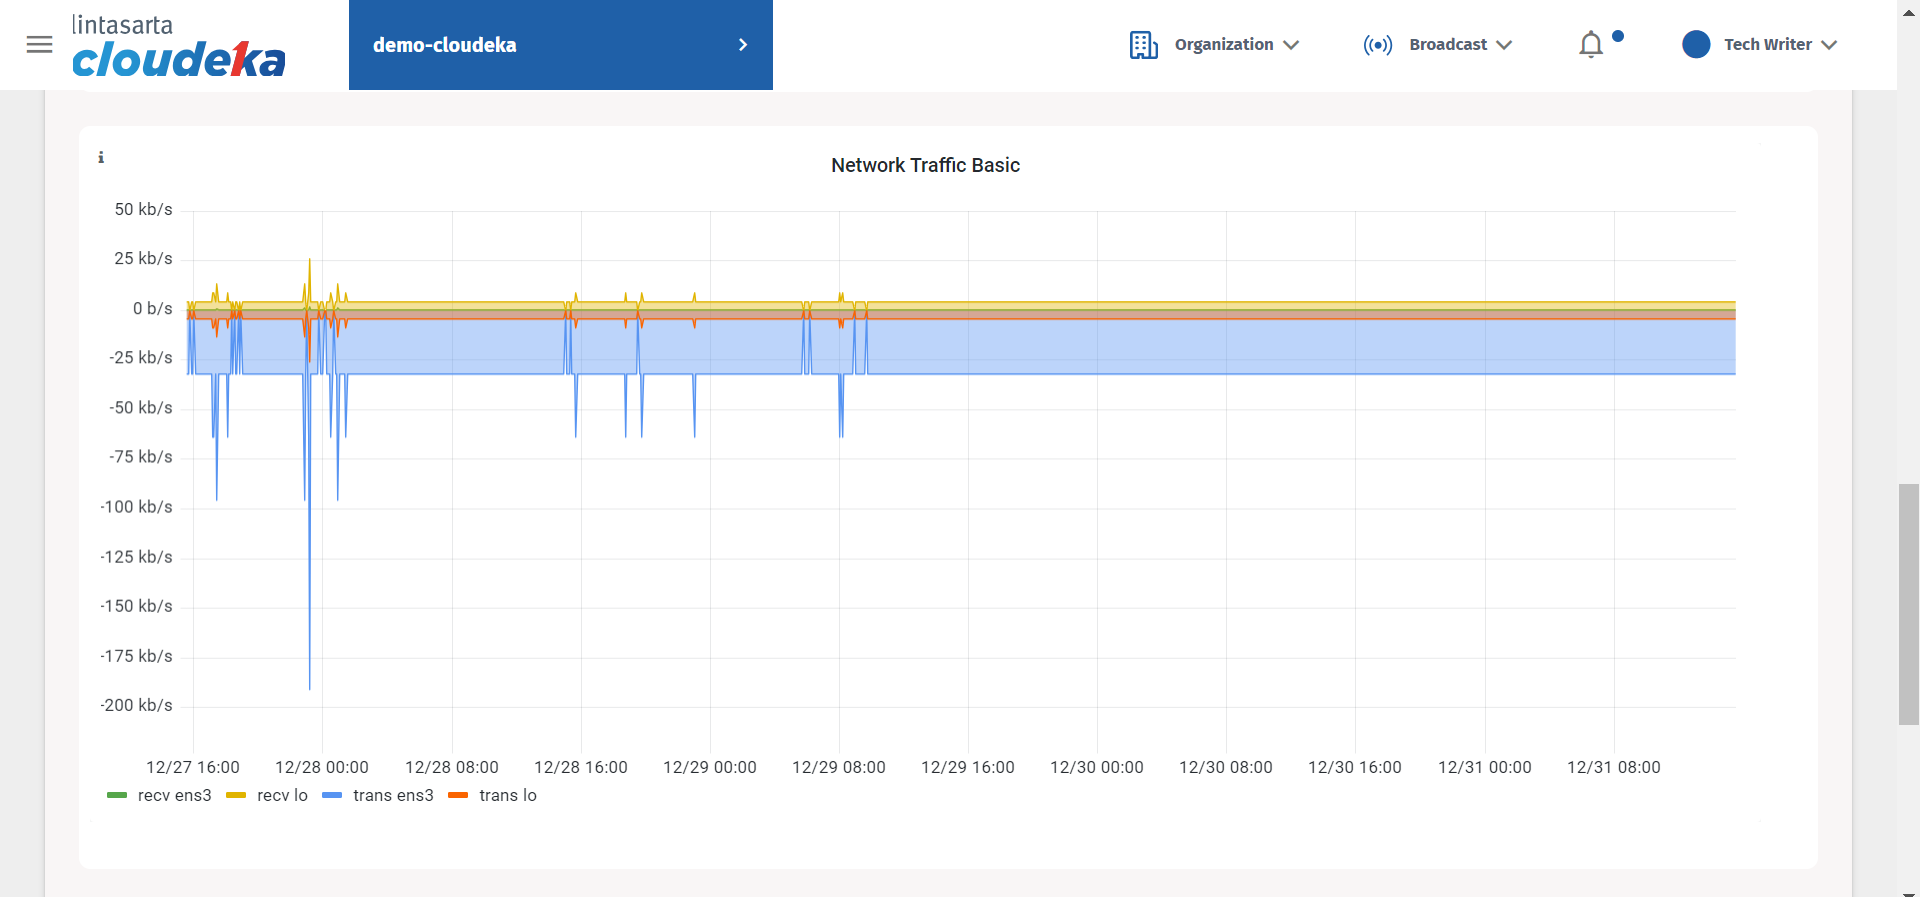
Basic CPU / Mem / Net / Disk - Network Trafic Basic
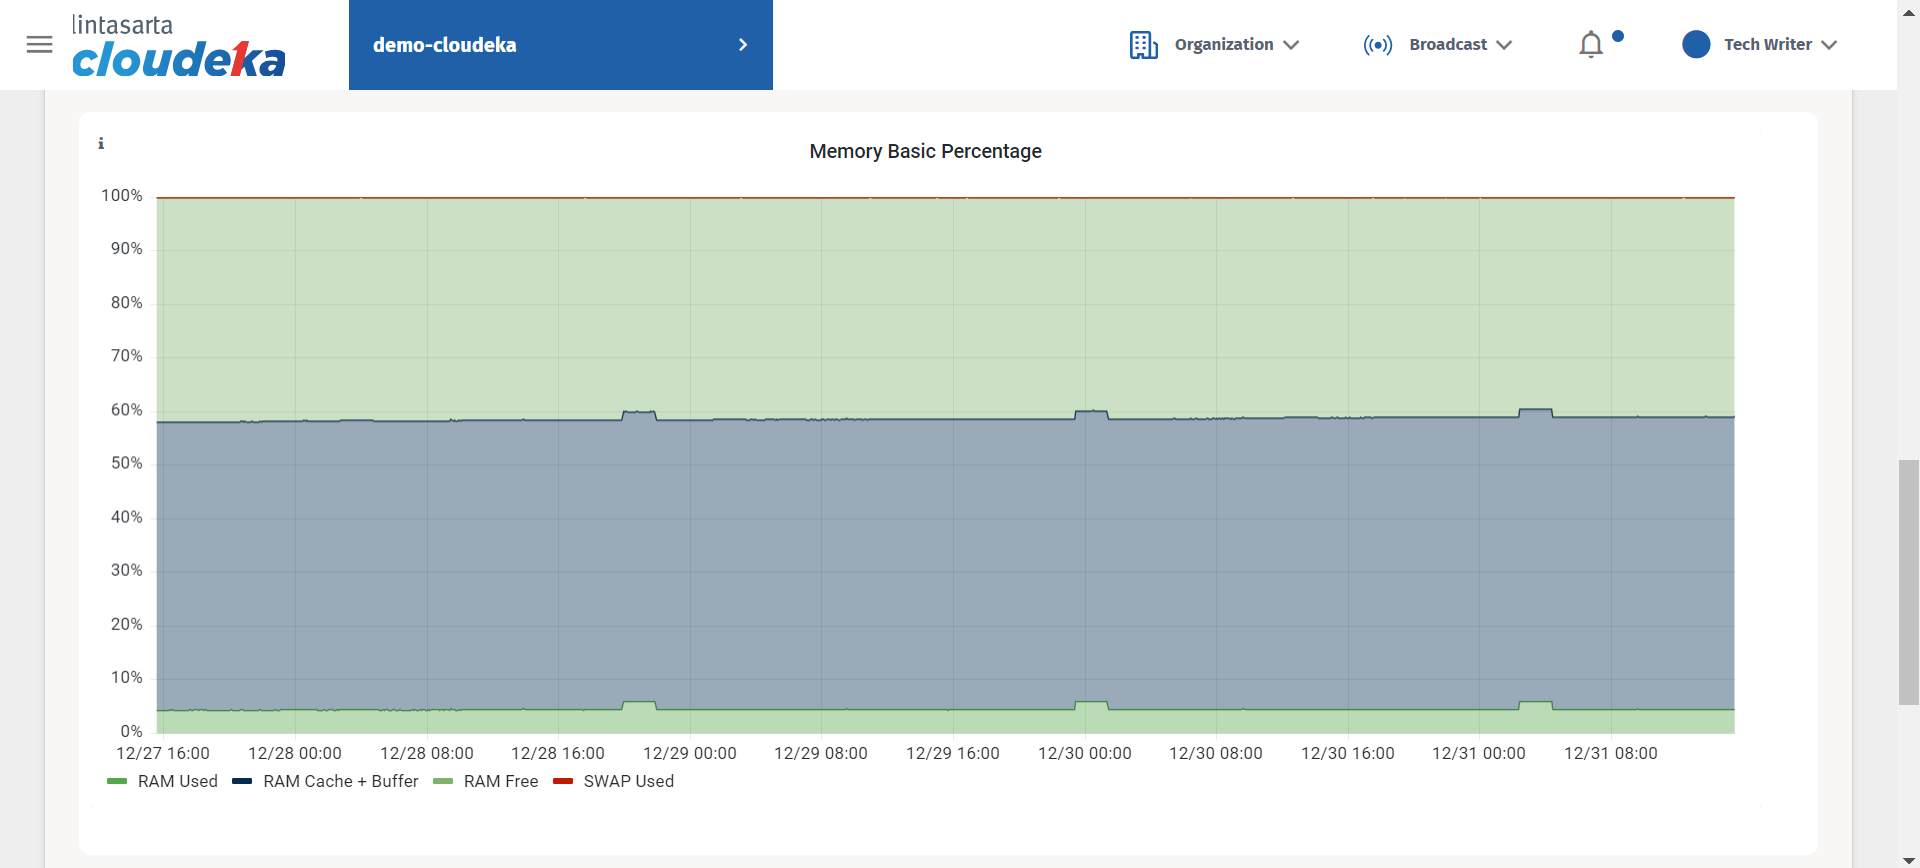
Basic CPU / Mem / Net / Disk - Memory Basic Percentage
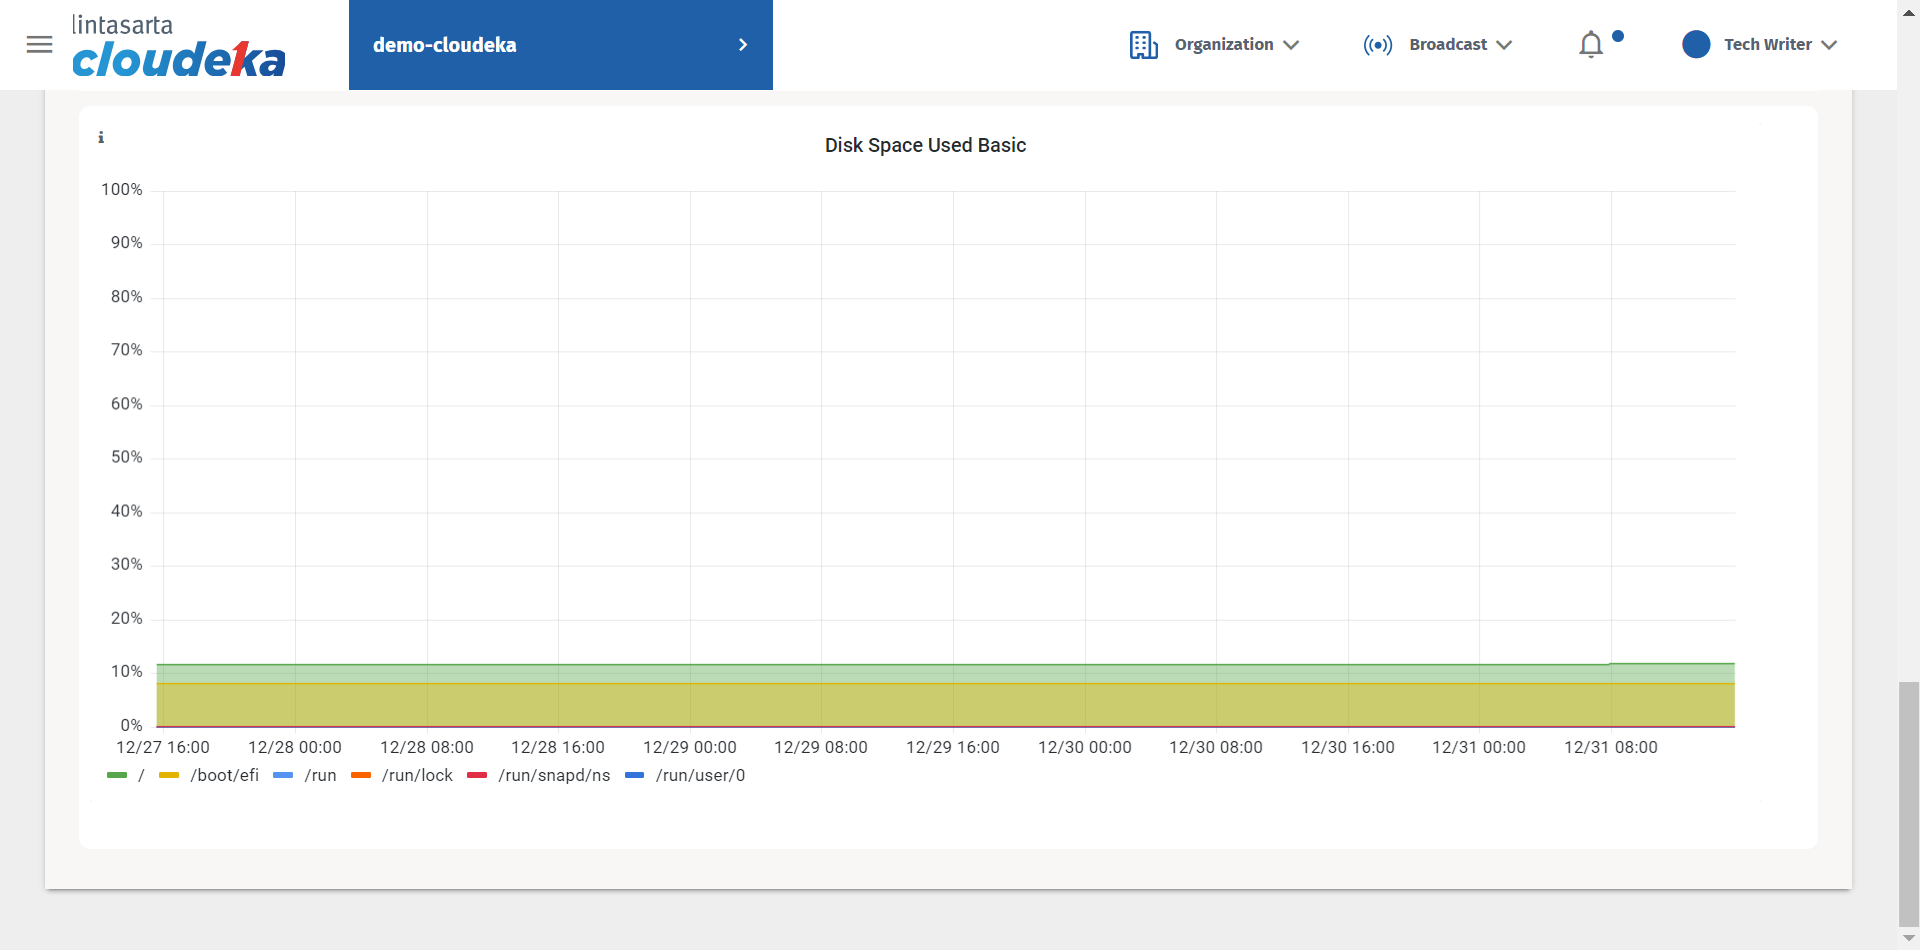
Basic CPU / Mem / Net / Disk - Disk Space Used Disk