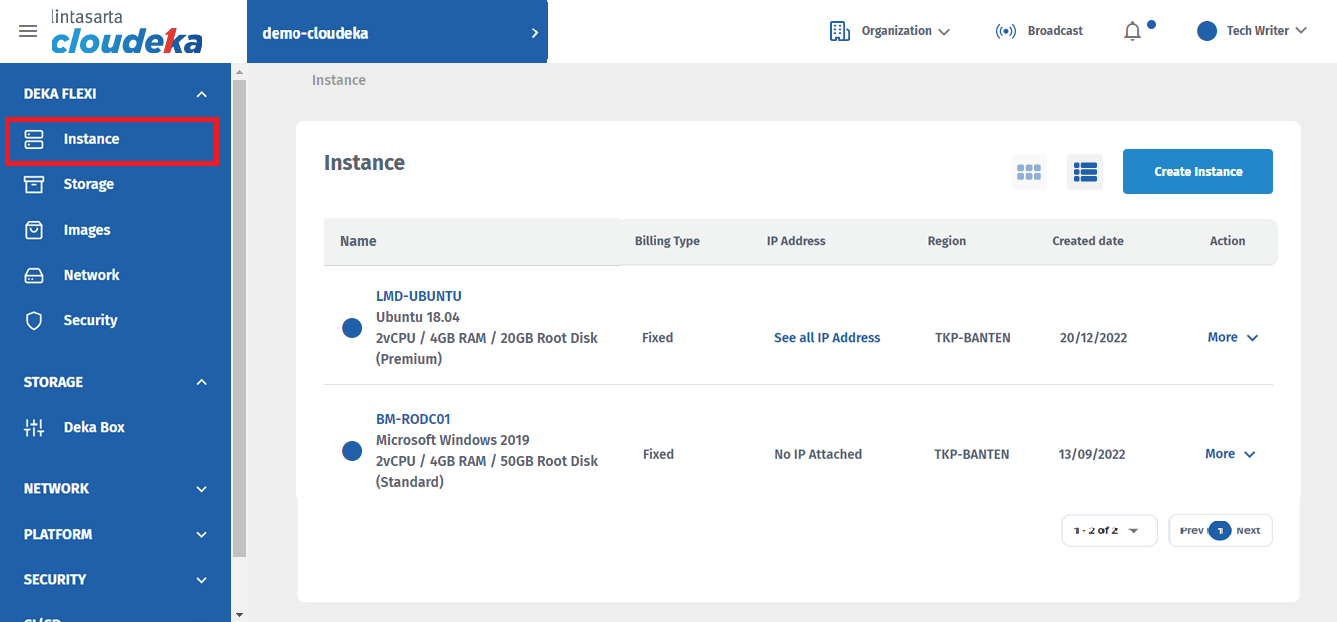
# Alerting Tes Implementation

To make sure that the alert is already working and applied to the instance, go to the console to trigger the CPU, RAM, and Network Usage by following these steps:

* Click the **Alerting** page.

<figure><img src="https://putri.box.cloudeka.id/cloudeka-assets/static/images/8alerting/8.14%20Instance%20Page.png" alt=""><figcaption><p>Instance Page</p></figcaption></figure>

* Select the **More** link, and then click the **Access Console** tab.

<figure><img src="https://putri.box.cloudeka.id/cloudeka-assets/static/images/8alerting/8.15%20Instance%20Page%20-%20Access%20Console.png" alt=""><figcaption><p>
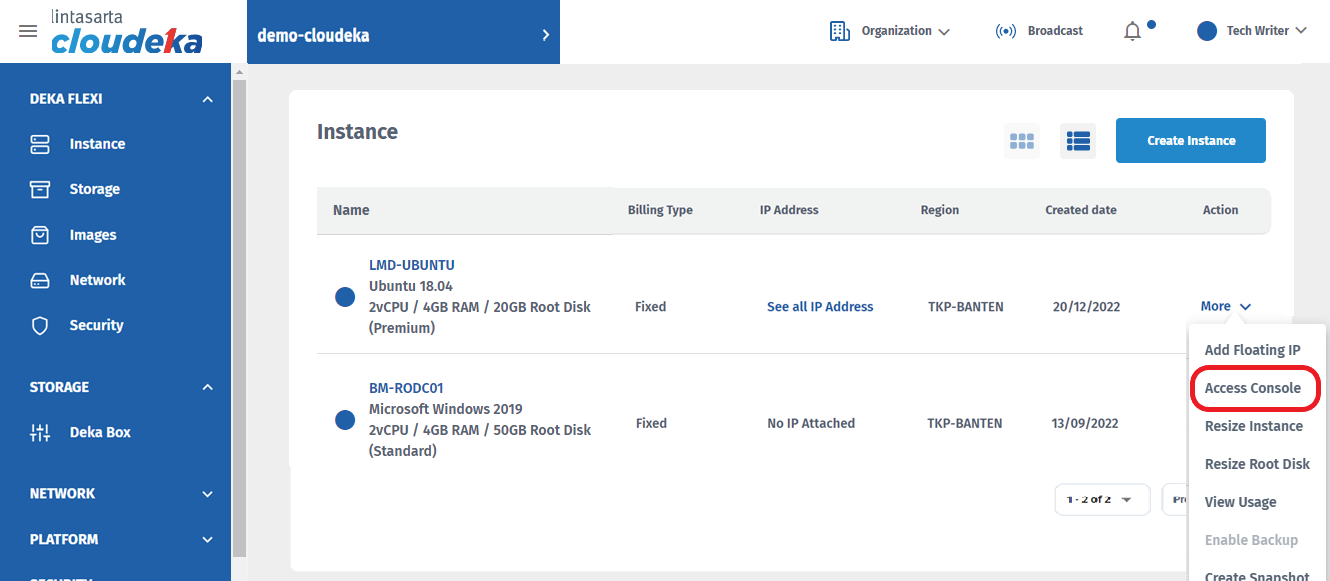
Instance Page - Access Console
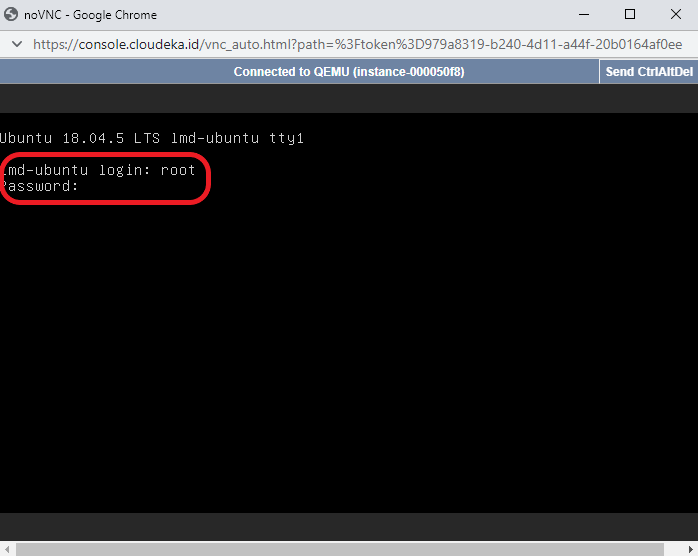
</p></figcaption></figure>

* Then, login to the instance using **username** and **password** that have been set while creating the instance.

<figure><img src="https://putri.box.cloudeka.id/cloudeka-assets/static/images/8alerting/8.16%20Instance%20Login.png" alt=""><figcaption><p>Instance Login</p></figcaption></figure>

* If the login is successful, then use these following commands to trigger the metric usage. **For example**, in this step try to trigger the **CPU Usage** and the recipients will receive the alert on their email address.

<table><thead><tr><th width="166">Metric</th><th>Trigger Command</th></tr></thead><tbody><tr><td><strong>CPU</strong></td><td>for i in 1; do while true; do :; done &#x26; done</td></tr><tr><td><strong>RAM</strong></td><td>cat /dev/zero</td></tr><tr><td><strong>Disk</strong></td><td>dd if=/dev/zero of=/tmp/tecst1.img bs=800MB count=1</td></tr><tr><td><strong>Network</strong></td><td>wget https://cloud-images.ubuntu.com/bionic/current/bionic-server-cloudimg-amd64.img
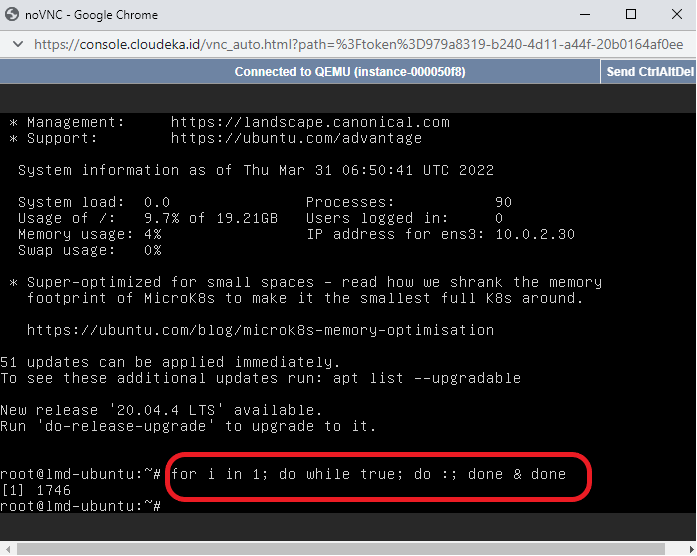
</td></tr></tbody></table>

<figure><img src="https://putri.box.cloudeka.id/cloudeka-assets/static/images/8alerting/8.17%20CPU%20Trigger%20Command.png" alt=""><figcaption><p>CPU Trigger Command</p></figcaption></figure>

* Check the CPU Usage Diagram on **Details Instance** page. If the trigger command is running there will be ups or downs on the graphic line of the CPU Usage Diagram. Then, the alert will notify the recipients based on the conditions that have been applied to it. **For example**, the recipients will receive an alert on their email address if the **CPU Usage is above 1%** and will keep receive the alert **once per minutes** based on the alert settings.

<figure><img src="https://putri.box.cloudeka.id/cloudeka-assets/static/images/8alerting/8.18%20CPU%20Diagram%20After%20Trigger.png" alt=""><figcaption><p>
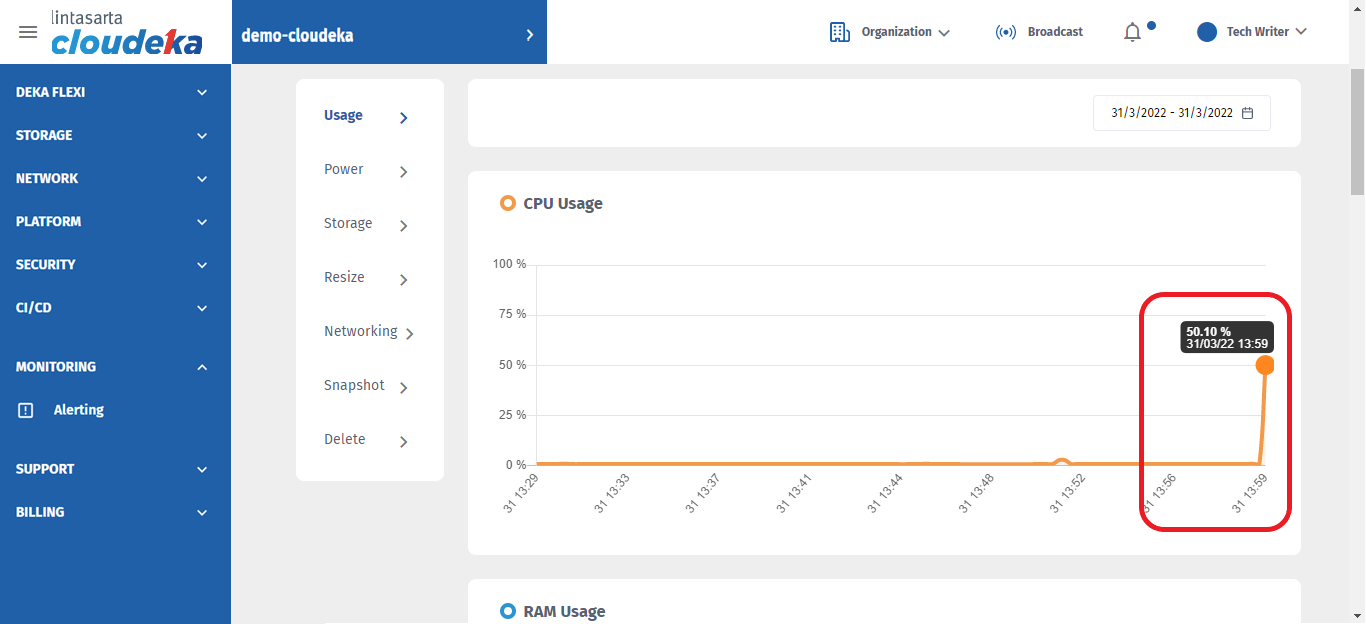
CPU Diagram After Trigger
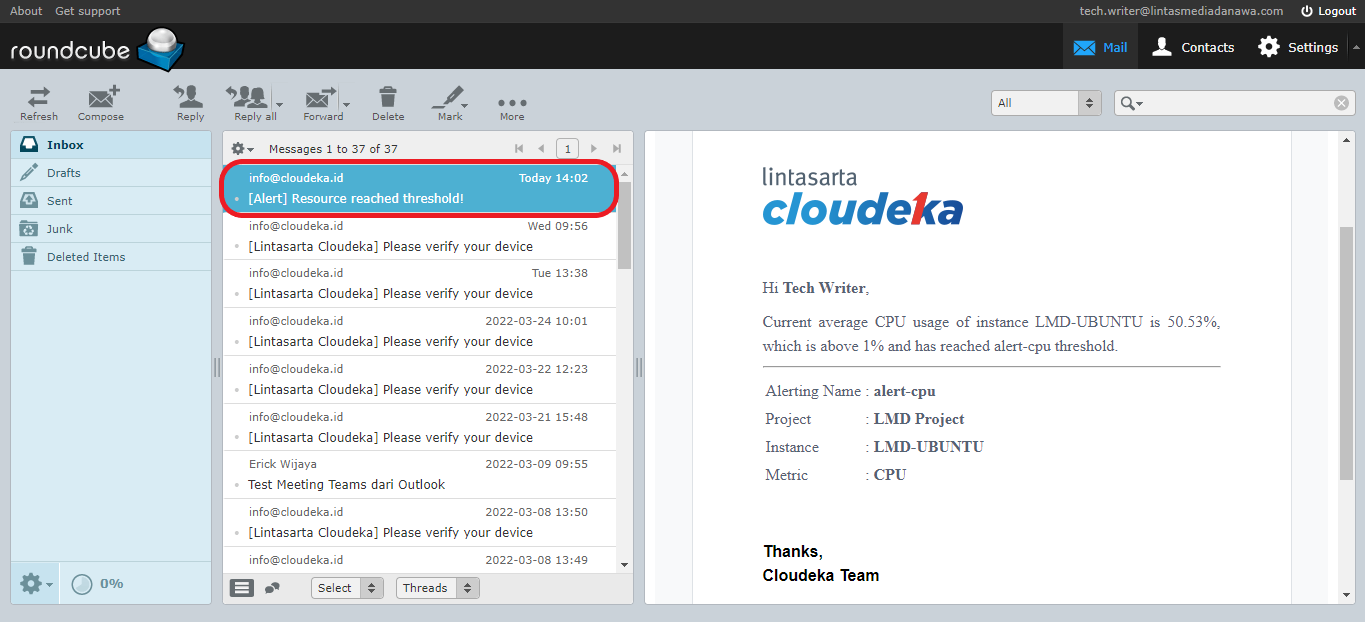
</p></figcaption></figure>

<figure><img src="https://putri.box.cloudeka.id/cloudeka-assets/static/images/8alerting/8.19%20Recipients%20Alert.png" alt=""><figcaption><p>Recipients Alert</p></figcaption></figure>
